

When it comes to running a business, it’s hard to imagine anyone knowing more about the market in question than the owners and operators who deal with it on a daily basis. The accounts receivable management (ARM) industry is no exception.
When asked what drives their businesses, most leaders provide a broad or generic response like “market conditions,” “client needs,” or “the economy.” While it’s true that these three factors all impact business performance, it’s hard to take much away from these statements because they are very broad and far-reaching concepts. What’s more, how do you apply these broad concepts to your forecasts or budget predictions with so many unknown variables? You can’t. This also becomes problematic if you’re trying to sell your business because buyers like to ask, “What is the forecast for the business, and what is driving this growth?” If you don’t have a more specific answer to this question, it could significantly lower the purchase price of your business and/or result in a longer earn-out period.
This is where a discerning eye for financial modeling and an understanding of key drivers that impact an industry’s performance come into play. Instead of qualifying your predictions with broad concepts, we recommend utilizing hard, quantifiable data to build your budgets and forecasts. This data comes from inside and outside your operation, and it’s determined by your specific market segment. For ARM companies, data from within your operation may include the number of collectors, accounts placement volume, account size, cost of infrastructure, or other operation-specific variables. Outside of the operation, we would identify two types of variables. The first includes broad economic measures – unemployment, disposable income, or consumer credit growth – that might be adjusted on a regional basis. The second type includes industry-specific variables, such as student loan delinquency rates, average credit card account balances, market mergers, or the number of new auto loan accounts.
However, it’s not just about identifying variables that might be related to your market; all variables are not created equal. Furthermore, by accounting for too many variables you fall into the same trap of using the economy to explain your business. Experienced analysts help isolate which variables provide the greatest bang for your buck, while maintaining a high degree of explanatory power.
Consider the case of the health care industry, which is comprised of numerous market segments like hospitals, physicians, dentists, and equipment suppliers. If we want to determine the size of the hospital market for all ARM companies, we have two main variables to consider: revenue and charge-offs. Intuitively, revenue and charge-offs go hand-in-hand. As revenue grows, even if the charge-off rate remains unchanged, the absolute value of charge-offs grows by the same rate as revenue. For simplicity’s sake, we will focus on hospital revenue growth.
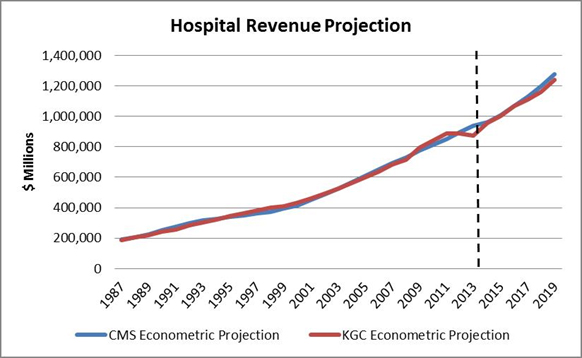
Using data on U.S. health care expenditures from the Center for Medicare and Medicaid (CMS), we identified several key economic drivers around funding, age, and disposable income that allow us to build a predictive model for revenue growth. Comparing our results (red) against the results of an actuarial model by the CMS (blue), we see that our model fairly accurately recasts historical performance and trends closely to the CMS forecast for hospital revenue growth. More specifically, our model produces an adjusted R2 of 0.991, which means that with just a few key variables we are accounting for more than 99 percent of the variation from the variables impacting hospital revenue.
This example focused on forecasting hospital revenue for 2015 through 2019 – a key component of our market intelligence reporting. Given access to historical data, this same process can be applied to any business. Kaulkin Ginsberg’s team and partners at Topline Valuation Group work with you to collect and analyze all of the internal and external variables impacting your business to determine which ones provide the greatest explanatory power when developing your business forecasting model. Once these variables have been identified, we’ll also show you how to use this information as a new tool for tracking and analyzing productivity within your operation.
For more information on developing a business forecasting model or other business services, you can contact us at hq@kaulkin.com.

![Report cover reads One Conversation Multiple Channels AI-powered Multichannel Outreach from Skit.ai [Image by creator from ]](/media/images/Skit.ai_Landing_Page__Whitepaper_.max-80x80.png)
![Report cover reads Bad Debt Rising New ebook Finvi [Image by creator from ]](/media/images/Finvi_Bad_Debt_Rising_WP.max-80x80.png)
![Report cover reads Seizing the Opportunity in Uncertain Times: The Third-Party Collections Industry in 2023 by TransUnion, prepared by datos insights [Image by creator from ]](/media/images/TU_Survey_Report_12-23_Cover.max-80x80.png)
![[Image by creator from ]](/media/images/Skit_Banner_.max-80x80.jpg)
![Whitepaper cover reads: Navigating Collections Licensing: How to Reduce Financial, Legal, and Regulatory Exposure w/ Cornerstone company logo [Image by creator from ]](/media/images/Navigating_Collections_Licensing_How_to_Reduce.max-80x80.png)
![Whitepaper cover text reads: A New Kind of Collections Strategy: Empowering Lenders Amid a Shifting Economic Landscape [Image by creator from ]](/media/images/January_White_Paper_Cover_7-23.max-80x80.png)